
K&C Test Descriptions
Standard Kinematic and Compliance Tests
Here are the K&C test descriptions for the most common tests we run. Bear in mind that this testing is flexible, and tests are customized to suit the needs of the customer. Special cases often arise and tests are designed to suit. For example, the application of offset lateral loads to simulate pneumatic trail effects, or combined loading tests to better understand the full impact of compliance, etc. The following overview of standard tests provides an idea of the types of measurements that can be made on the K&C test machine. If specific vehicle measurements are required, give us a call, challenge us, and we’ll do our best to create tests that will capture the measurements that you want to see.
Click here to learn about how K&C testing works, or how to plan a test.
What Data is Reported?
During each test, key suspension parameters are measured, recorded, and graphed real-time. Upon the completion of each test, real-time summary reports are generated that provide all of the key metrics from that test. These reports include relevant curve fits, a compiled bookmarked PDF, and a spreadsheet summarizing all of the curve fit coefficients in one place.
In addition to reports, data for all tests is provided in ASCII text and Matlab® formats. Text files that can be readily imported into Pi Toolbox® are also available. Further, a free MS Excel™ K&C Grapher Tool is provided. This program reads in data files and allows easy curve fitting and overlays of multiple data sets.
Measurement results are presented in a clear, concise and digestible way. Rather than being “overwhelmed with data,” customers leave Morse Measurements with useful results that will help improve the vehicle.
Standard K&C Test Descriptions
Now on to the descriptions, if a PDF is better for you you can download these test descriptions bellow.
Bounce Test Description
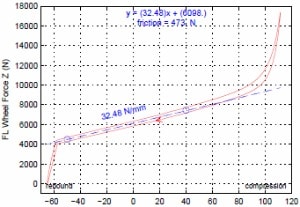
The vehicle chassis is exercised in a pure bounce motion. This is accomplished by moving the K&C rig’s center table straight up and down within defined displacement bounds (For example, + 2.0 inches from baseline ride height). The vehicle chassis is clamped directly to the center table, thus it is exercised straight up and down as well.
During this test lateral and longitudinal forces, and aligning moments are maintained at zero at each tire contact patch, thus canceling any unwanted tire “scrub” forces, and allowing the suspension to move freely without binding. The slow speed of this test (cycle times are typically ~ 1 minute) removes unwanted damper and inertial forces from the tire vertical load measurements. Corresponding loads, displacements, and orientations are measured at each of the four wheels.
Characteristics measured in a bounce test:
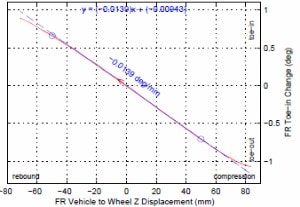
- Bump Steer
- Bump Camber
- Bump Caster
- Wheel Recession
 Tire Radial Rates
- Wheelbase Change
- Track Width Change
- W/C Lateral & Longitudinal
- Displacement
- Kinematic Anti-Dive & Anti-Squat Angles
- Virtual Swing Arm (VSA) Length & Angle
- Ride Rates (ground to chassis, includes tire)
- Kinematic Roll Center (KRC) Height & Locus
- Wheel Rates (wheel to chassis only, without tire)
- Friction / Hysteresis
- Lateral & Longitudinal Tire Center of Geometry (COG) Displacement
- Lateral & Longitudinal Tire Center of Pressure (COP) Displacement
Bounce-Pitch Test Description
The vehicle is exercised in a bounce motion with some pitch angle introduced to achieve a differing amount of wheel travel front and rear. For example, if the chassis is pitched forward as it is bounced, the front will travel further than the rear.
During this test lateral and longitudinal forces, and aligning moments are maintained at zero at each tire contact patch, thus canceling any unwanted tire “scrub” forces, and allowing the suspension to move freely without binding. The slow speed of this test (cycle times are typically ~ 1 minute) removes unwanted damper and inertial forces from the tire vertical load measurements. Corresponding loads, displacements, and orientations are measured at each of the four wheels.
 Characteristics measured in bounce-pitch test:
- Bump Steer
- Bump Camber
- Tire Radial Rates
- Track Width Change
- W/C Lateral Displacement
- Ride Rates (ground to chassis, includes tire)
- Wheel Rates (wheel to chassis only, without tire)
- Friction / Hysteresis
- Lateral Tire Center of Geometry (COG) Displacement
- Lateral Tire Center of Pressure (COP) Displacement
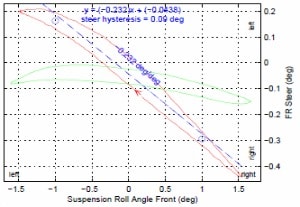
Roll Test Description
The vehicle chassis is exercised in roll. This may be done about a fixed axis in the ground plane, or it may be done about a “natural” roll axis. In the natural axis test, compensation is provided in pitch and heave in order to maintain constant front and rear axle loads. This results in vehicle roll about its “natural” roll axis. Roll tests are accomplished by moving the K&C rig’s center table in roll within defined displacement bounds (For example, + 1.5 degrees from baseline ride height, zero roll angle). The vehicle chassis is clamped directly to the center table, thus it is exercised in roll as well.
During a roll test lateral and longitudinal forces, and aligning moments are maintained at zero at each tire contact patch, thus canceling any unwanted tire “scrub” forces, and allowing the suspension to move freely without binding. The slow speed of this test (cycle times are typically ~ 1 minute) removes unwanted damper and inertial forces from the tire vertical load measurements. Corresponding loads, displacements, and orientations are measured at each of the four wheels.
Characteristics measured in a roll test:
- Axle Steer
- Total Roll Steer
- Tire Vertical Force
- Total Roll Camber
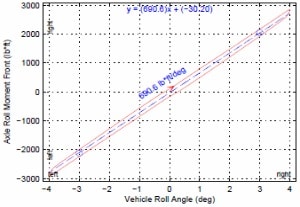 Total Roll Stiffness
- Track Width Change
- Suspension Roll Steer
- Suspension Roll Camber
- Suspension Roll Stiffness
- Static Roll Weight Transfer Coefficient
- Wheel Rates in Roll
- Friction / Hysteresis
- Tire Contact Patch (TCP) Lateral Displacement
Steering Test Description
The vehicle chassis is held fixed by the K&C rig center table. The handwheel is steered smoothly through its full range of motion with a computer-controlled steering robot. Loads, displacements, and orientations are measured at the handwheel and at each of the steered wheels. This test may be run with no load on the road wheels, or with resistive aligning torque and/or lateral and longitudinal loads.
Characteristics measured in a steering test:
- Kingpin Offset
 Caster Angle
- Mechanical Trail
- Camber Change
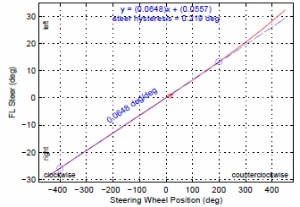
- Roadwheel Steer
- Handwheel Torque
- Ackermann Percent
- Kingpin Inclination Angle
- Instantaneous Steering Ratio
- Tire Contact Patch (TCP) Locus
- Scrub Radius vs. Handwheel Steer
- Friction / Hysteresis
Longitudinal Compliance Test Description
Longitudinal Compliance, Braking
The vehicle chassis is held fixed by the K&C rig center table while longitudinal forces are applied through each of the four tire contact patches. Vehicle brakes are applied. Forces are applied in the direction consistent with braking. Corresponding loads, displacements, and orientations are measured at each of the four wheels.
Longitudinal Compliance, Traction
The vehicle chassis is held fixed by the K&C rig center table while longitudinal forces are applied at each tire contact. Vehicle brakes are not applied. A transmission or drivetrain lock is used on the driven axle(s) to transmit ground plane forces to the wheel centers while ground plane forces are applied through the tire contact patches. Force is applied in the direction consistent with vehicle forward acceleration. Corresponding loads, displacements, and orientations are measured at each of the four wheels.
Longitudinal Compliance, Single Wheel
The vehicle chassis is again held fixed and longitudinal force is applied to wheels on one side of the vehicle only. This shows how force applied to one side affects the other side. It also simulates a worst case split mu surface condition.
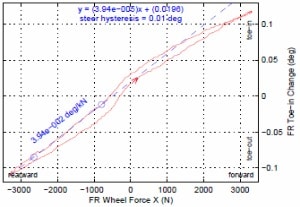 Characteristics measured in a longitudinal compliance test:
- W/C Stiffness
- Toe Stiffness
- Jacking Forces
- Caster Stiffness
- Camber Stiffness
- Hysteresis
- Force Anti-Dive Angle (Braking Test)
- Force Anti-Squat Angle (Traction Test)
Lateral Compliance Test Description
Lateral Compliance, Parallel
The vehicle chassis is held fixed by the K&C rig center table while lateral forces are applied through each of the four tire contact patches, in line with the center of tire contact pressure. ‘Parallel’ indicates that force is applied through each wheel in the same direction (i.e. all forces to the left, and/or all forces to the right). Corresponding loads, displacements, and orientations are measured at each of the four wheels.
Lateral Compliance, Opposed
The vehicle chassis is held fixed by the K&C rig center table while lateral forces are applied through each of the four tire contact patches, in line with the center of tire contact pressure. ‘Opposed’ indicates that force is applied through each wheel in opposing directions at each axle. While a lateral parallel test will capture the effects of left/right suspension connectivity components (such as the steering system, subframes, anti-roll bars, etc.), the opposed test, by nature of applying equal and opposite forces to left and right side suspensions – and thus “shorting out” any right/left connective components, will capture the effects of an individual suspension corner. Corresponding loads, displacements, and orientations are measured at each of the four wheels.
Lateral Compliance, Single Wheel
The vehicle chassis is again held fixed and lateral force is applied to wheels on one side of the vehicle. This allows you to measure the reaction of wheels on the opposite side of the car to forces.
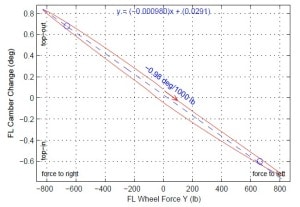 Characteristics measured in a lateral compliance test:
- Axle steer
- Tire Stiffness
- W/C Stiffness
- Toe Stiffness
- Jacking Forces
- Camber Stiffness
- Force-Based Roll Center (FBRC)
- Height & Locus (Parallel Test only)
Aligning Torque Test Description
Aligning Torque, Parallel
The vehicle chassis is held fixed by the K&C rig center table while ground plane torques are applied through each of the four tire contact patches. ‘Parallel’ indicates that torque is applied through each wheel in the same direction (i.e. all torques clockwise, and/or all torques counter-clockwise). Corresponding loads, displacements, and orientations are measured at each of the four wheels.
Aligning Torque, Opposed
The vehicle chassis is held fixed while ground plane torques are applied through each of the four tire contact patches. ‘Opposed’ indicates that torque is applied through each wheel in opposing directions at each axle. While an aligning torque parallel test will capture the effects of left/right suspension connectivity components (such as the steering system, subframes, anti-roll bars, etc.), the opposed test, by nature of applying equal and opposite torques to left and right side suspensions – and thus “shorting out” any right/left connective components, will capture the effects of an individual suspension corner. Corresponding loads, displacements, and orientations are measured at each of the four wheels.
Aligning Torque, Single Wheel
The vehicle chassis is again held fixed while aligning torque is applied to wheels on one side of the vehicle only.
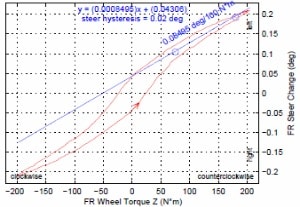 Characteristics measured in an aligning torque test:
- Toe Stiffness
- Tire Aligning Stiffness
- Hysteresis
- Steering Torque Feedback
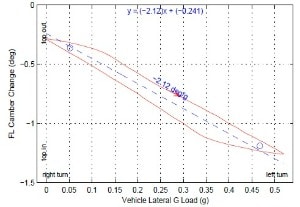
Cornering Simulation Test Description
The test simulates a pure cornering event. Inputs are the CG height, the desired cornering G load, and optionally aerodynamic download and tire pneumatic trail. Based on the CG. height, the G load, and the vehicle weight, a roll moment is applied to the chassis while corresponding ground plane lateral force is applied at each tire contact. Lateral force distribution amongst the four tires may be specified or can be proportional to the vertical load. The chassis is controlled in force control such that it finds a natural steady state cornering attitude. Chassis loads and displacements, as well as corresponding loads, displacements, and orientations at each of the four wheels are measured.
Further, after running the cornering simulation, the chassis motion is replayed through the rig without the ground plane forces present. This allows you to separate kinematics effects from compliance effects.
Characteristics measured in a cornering simulation test:
 Axle Steer
- Steer Rate
- Camber Rate
- Jacking Forces
- Roll Rate (per G)
- Roll Stiffness Total
- Lateral Weight Transfer
- Tire COP Migration
- Tire Deflection Lateral
- Roll Rate (per Torque)
- Tire Lateral & Vertical Forces
- Dynamic Cross Weight
- Friction / Hysteresis
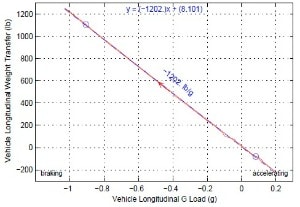
Braking Simulation Test Description
The test simulates a pure braking event. Inputs are the CG height, the desired braking G load, and optionally aerodynamic download. Based on the CG height, the G load, and the vehicle weight, a pitch moment is applied to the chassis while corresponding ground plane longitudinal force is applied at each tire contact. Longitudinal force distribution amongst the four tires may be specified or can be proportional to the vertical load. The chassis is controlled in force control such that it finds a natural steady-state braking attitude. Chassis loads and displacements, as well as corresponding loads, displacements, and orientations at each of the four wheels are measured.
After running the braking simulation, the chassis motion is replayed through the rig without the ground plane forces present. This allows you to separate kinematics effects from compliance effects.
 Characteristics measured in a braking simulation test:
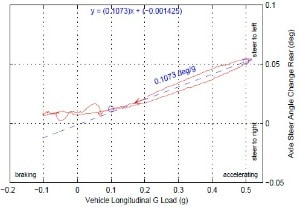
- Axle Steer
- Steer Rate
- Jacking Forces
- Pitch Rate (per G)
- Pitch Stiffness Total
- Longitudinal Weight Transfer
- Tire COP Migration
- Tire Deflection Lateral
- Pitch Rate (per Torque)
- Tire Longitudinal & Vertical Forces
- Cross Weight
- Friction / Hysteresis
Traction Simulation Test Description
The test simulates a pure acceleration event. Inputs are the CG height, the desired acceleration G load, and optionally aerodynamic download. Based on the CG height, the G load, and the vehicle weight, a pitch moment is applied to the chassis while corresponding ground plane longitudinal force is applied at each driven tire contact. Longitudinal force distribution amongst the driven tires may be specified or can be proportional to the vertical load. The chassis is controlled in force control such that it finds a natural steady-state acceleration attitude. Chassis loads and displacements, as well as corresponding loads, displacements, and orientations at each of the four wheels are measured.
After running the traction simulation, the chassis motion is replayed through the rig without the ground plane forces present. This allows you to separate kinematics effects from compliance effects.
 Characteristics measured in a traction simulation test:
- Axle Steer
- Steer Rate
- Jacking Forces
- Pitch Rate (per G)
- Pitch Stiffness Total
- Longitudinal Weight Transfer
- Tire COP Migration
- Tire Deflection Lateral
- Pitch Rate (per Torque)
- Tire Longitudinal & Vertical Forces
- Dynamic Cross Weight
- Friction / Hysteresis
Combined Loading Simulation Test Description
This test is a combination of a cornering simulation and a braking or traction simulation. Simultaneously, a lateral and longitudinal G loading is specified, corresponding roll and pitch moments are applied to the chassis, and corresponding ground plane forces (lateral and longitudinal) are applied at the four tire contacts.
The vehicle chassis is exercised to match known on-road/track conditions of interest. Typically this is done for several conditions through a known corner (for example, corner entry, mid, and exit). Using acquired vehicle data (such as damper pots, steering sensors, etc.) it is possible to load a vehicle with roll and pitch moments and corresponding lateral and longitudinal tire loads. Some vehicle information is required in order to properly set up this test, namely: Overall CG height, desired braking and cornering acceleration levels, steering position (handwheel, rack travel, etc.), aerodynamic downforce loads, front/rear brake percentage and banking angle (if applicable).
After running the combined loading simulation, the chassis motion is replayed through the rig without the ground plane forces present. This allows you to separate kinematics effects from compliance effects.
 Characteristics measured in a combined loading simulation test:
- Axle Steer
- Steer Rate
- Camber Rate
- Jacking Forces
- Roll Rate (per G)
- Pitch Rate (per G)
- Roll Stiffness Total
- Tire COP Migration
- Tire Deflection Lateral
- Roll Rate (per Torque)
- Pitch Rate (per Torque)
- Tire Lateral, Longitudinal, & Vertical Forces
- Dynamic Cross Weight
- Friction / Hysteresis
Did you know?
You can get K&C data without vehicle sourcing, shipping, or test planning.
Call Now: 704.638.6515
Call Now:
704.638.6515
![]()
![]()
![]()
1163 Speedway Blvd.,
Salisbury, NC 28146
Phone: 704.638.6515
Fax: 704.638.6516
Info@MorseMeasurements.com
© 2026 Morse Measurements | Powered by Miller Davis
![]()
![]()
![]()
1163 Speedway Blvd., Salisbury, NC 28146
Phone: 704.638.6515
Fax: 704.638.6516
Info@MorseMeasurements.com
© 2026 Morse Measurements | Powered by Miller Davis